The ultimate real estate investing spreadsheet.
If, like me, you have read through all the real estate investing books, you are all excited to start and want to get busy with the parts where you are evaluating properties to see if they will cash flow. You have probably ran into the issue that most do, all the calculators that are limited and behind pay-walls and the “real estate guru’s” who sell Excel spreadsheets and so on. It’s kind of irritating.
I noticed this also and want a spreadsheet that will do all the basics well, but also print nicely. Being a software engineer, I decided to create my own and I am happy to share it with you here.
Introduction to the sheet
I built this spreadsheet for myself.
I wanted my spreadsheet to do all the things the I have seen other spreadsheets do as well as have a very printable, good looking version I can make a hardcopy of to make notes on, file for later or to get a loan.
I wanted my spreadsheet to be simple, literally plug in a few values and see everything computed out to the end of a 30 year mortgage. I also wanted it to color code in red if things were not where I wanted them and in green when they were in the ranges I was looking for.
I also wanted it to scrape web pages to automatically get info on average rental prices for zip codes and to generate suggested values for some of the things you often need to look up like taxes and insurance.
No other sheet I found did this, so I made my own.
The sheet
Lets just jump right in, you can find the sheet HERE, you will need to make a copy of it and then lets walk through how to use it.
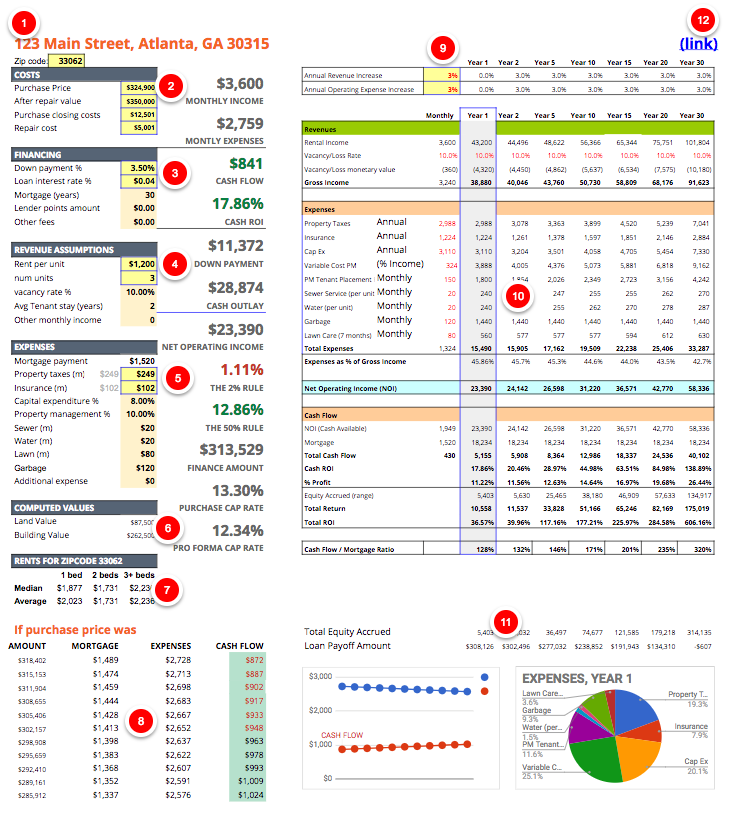
I have added numbers on the image below, use these as a reference. Note that you only really enter things on the left side, the bright yellow boxes are items critical to evaluating a property and the ones in darker yellow are less often changed but should be modified for your area.
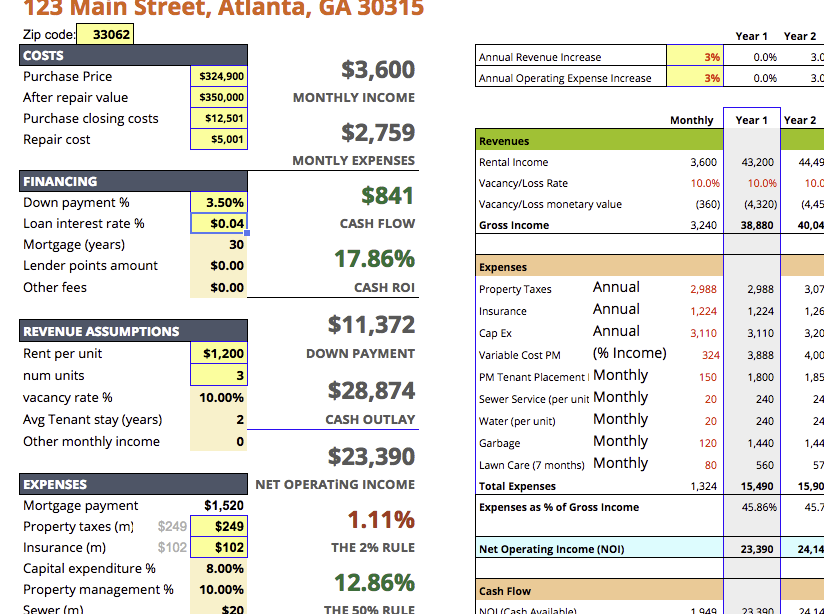
This is the “Entry” sheet.
- Here you will enter in the address of the property, this is just used for display and printing. The zipcode box here is important, so make sure to add in the zipcode for the property.
- In the yellow boxes, enter in the purchase price, the value after repair you expect (ARV calculation is typically based on comps and can be difficult, biggerpockets has a book word doc on it). And closing costs can be really complicated depending on where you live, you can find more info here. Repair cost is for one that will need some work. Typically ARV will be the asking price and repair cost will be zero.
- In the yellow boxes, enter in the down payment percentage (note, for percentages in Google sheets, make sure you add in a “%” sign after the number you enter) and the interest rate.
- Enter in the number of units in the property available to rent, for a single family, this will be one. Enter in the rental amount, see #7 “Rents for zipcode” to see the average unit rental prices for that zipcode. If a multi-family has units with different numbers of beds, just average the rental amounts.
- Property taxes and Insurance, notice the light gray numbers just to the left of the input boxes, those numbers are recommended numbers based on a couple assumptions. One, the tax percentage for your county can be looked up here. Find your state and county tax percentage and click on the gray number and in the formula bar you will see the following “=(E5*0.852%)/12”, change that 0.852% to whatever you get from the Smart asset site. The insurance number should be fine, it is based on very general numbers for insurance which are fairly typical across the country. If you have flood insurance you can add that into the “additional expenses” which is below this.
- This is the computed land value and building value, these are typically used for insurance.
- This data is from an external website that is updated when you change the zipcode at the top of the sheet. These are average and median rental amounts for your zip by number of bedrooms. It’s fairly accurate and should at least give you an idea what rent you can get.
- This is a goal seeking table, if your cash flow is below the target of $200/unit then you will see what offer you can make on the property which will get it to be profitable for you.
- Annual revenue and expense increase percentage. This is 2-3%, in some cases it is up to 5%, these can be modified and will cascade to all the yearly computed cells.
- This is breakdown of revenue, expenses and cash flow for the lifetime of the mortgage, years 1,2,5,10,15,20 and 30 are shown.
- This shows you the mortgage lifetime numbers for equity and paydown.
- This is a link to the property page, if you export this to PDF you can click on it to see the listing.
If you click over to the “printable” sheet you will get the automatically updated print version of the Entry sheet. (Note, the entry sheet can also be printed and looks fine). This page is designed to print on one page and have every relevant detail needed.
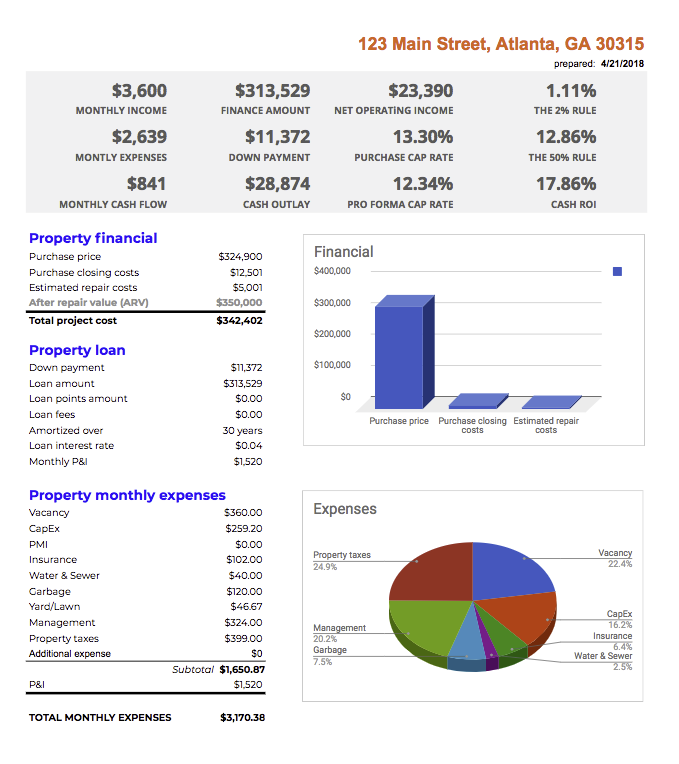
Looks good.
Now, to try this sheet out, lets run a property through it. I was just looking through multi-family properties in Atlanta and found this one, which looks great, but lets run the numbers.
Because this listing will not be up forever, I will add a picture here.
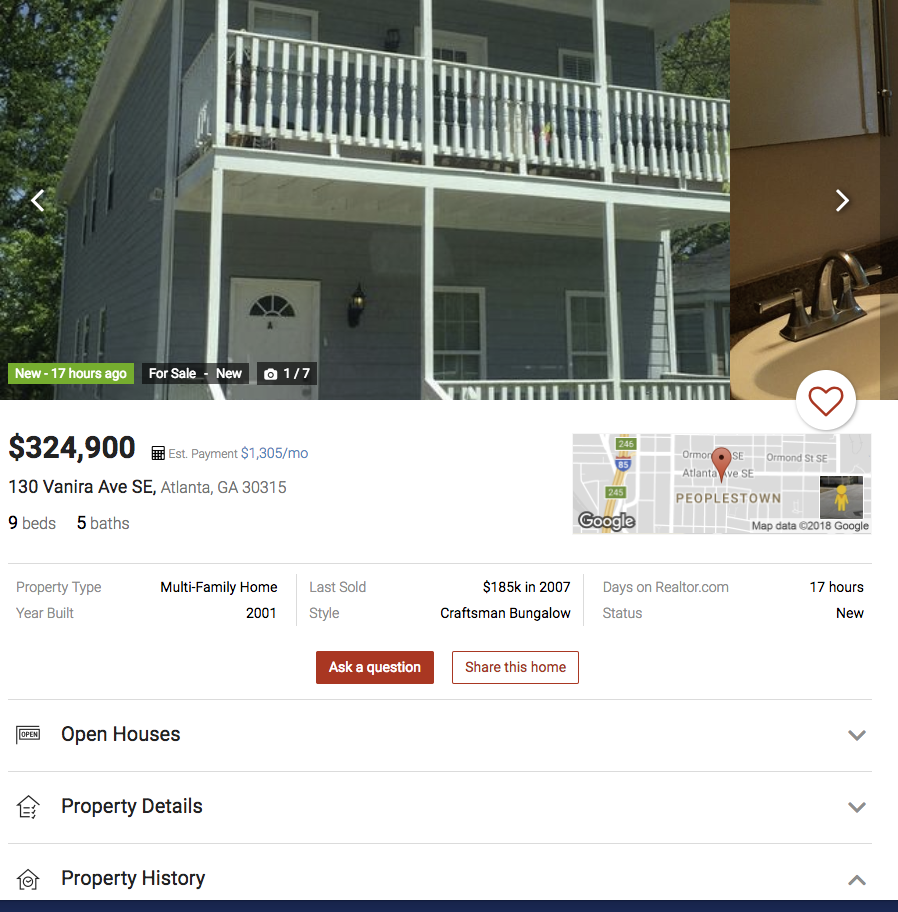
So, this property has a mix of units, two four bedroom units and one single bedroom unit. Once we enter in 30315 into the zipcode box above we are presented with the data that two of the units that will rent for at least $1,375 and one that will rent for $920. Doing the math real fast (1375*2)+920=$3670 total rental income per month for this property, we average this by dividing by 3, so $1,223 and that is the number you will plug into the spreadsheet.
Property taxes are estimated at $249, but looking on realtor.com the last year property taxes were $1,147, or about $95/month. Assuming it could go higher I would put in $100.
Based on these numbers, this property would cash flow good on the asking price and cash on cash ROI would be good. Here is what it looks like, I will explain a couple of things here.
NOTE: I was not adding in tenant placement costs previously and these can be significant, I decided to add them back in, so the numbers here will be slightly different, however this property still is fantastic and the numbers are good.
You will notice that property management is significant, and it really is. However, you should always plan for it even if you intend to manage the property yourself, then you know you have that as an option. If you don’t plan for management and you need to use it, your ‘investment’ will be costing you money.
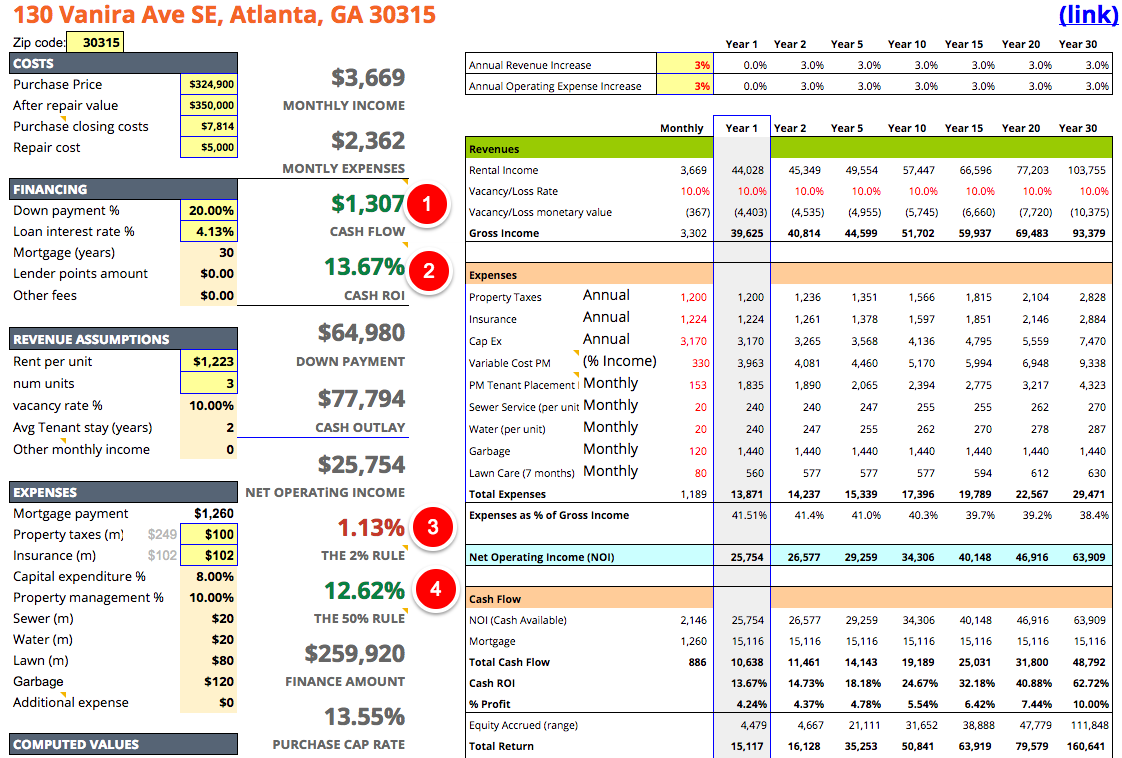
- Cashflow red=bad, green=good. Notice that it is green? The property makes double what we are looking for, $200 per unit is the goal, this makes $436 per unit.
- Cash ROI, this is the percentage of the total cash flow by all out of pocket cash (the down payment, the closing costs and repair costs). Our target here is 12%. This is us getting a return on our money and we want this to be close to or over 12%.
- The 2% rule is red, this is checking that monthly income is about 2% of the total purchase price. This is not a hard rule, especially for multi-family, just nice to see it green sometimes.
- The 50% is that if expenses – not counting the mortgage – are more than 50% of your gross rental income then there there are issues. The lower the better here.
This property cashflows well with the full 10% management fee, 10% vacancy rate and 8% CapEx. It’s worth the asking price and I would definitely put an offer on this property if I could right now.
Addendum
If you use this sheet, feel free to leave me comments here or on the FB page (link in upper right).
If you run across any errors in the sheet let me know. I have combed through it and triple-checked the main calculations, but there is a lot going on here, and sometimes you can get mis-pasting happen.